Data explorer#
The data explorer enables you to explore your datasets as well as inspecting inputs and outputs of the components. The explorer can be a helpful tool to debug your datasets and to get a better understanding of the data that is being processed. It can also be used to compare different materialized datasets which can be useful to understand the impact of changes in your workflow.
The explorer consists of 4 main tabs:
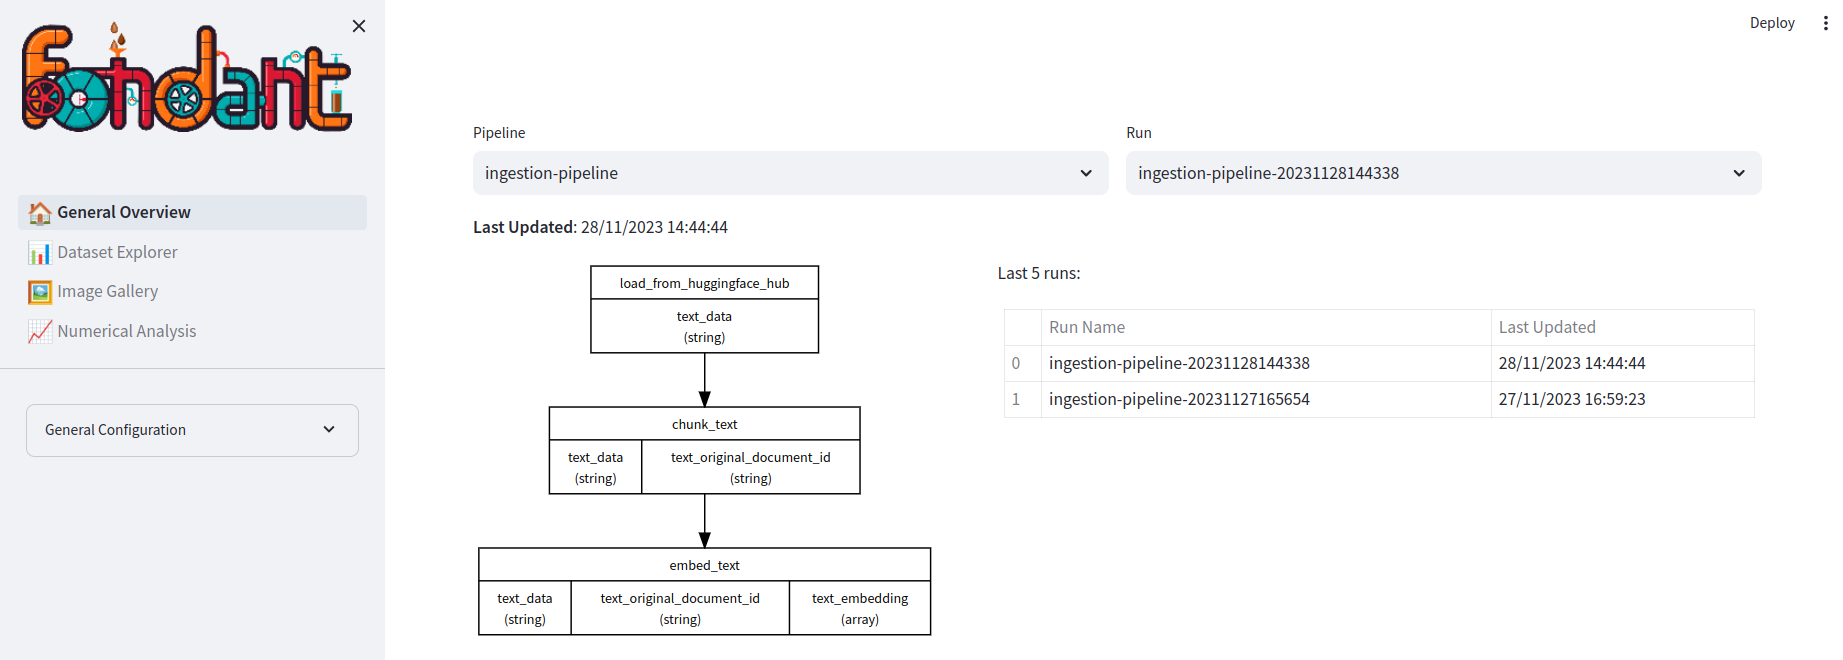
General Overview#
In the general overview, you can select the dataset and materialization run you want to explore. You will be able to see the different components that were run in the materialization run and get an overview of your latest runs.

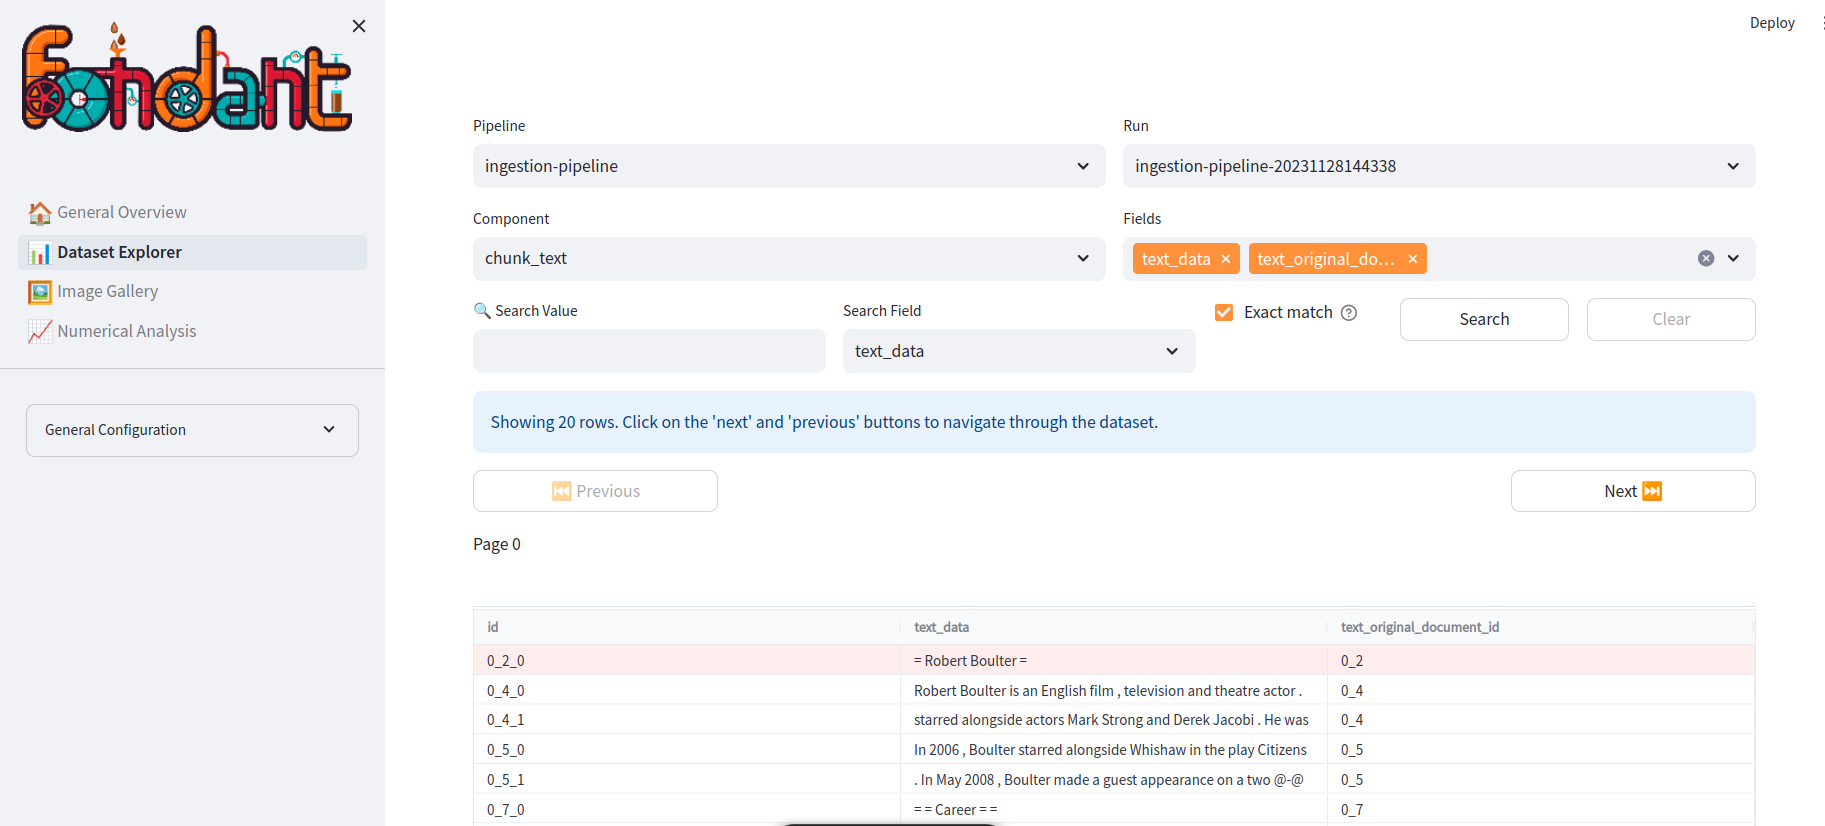
Dataset Explorer#
The data explorer shows an interactive table of the loaded fields from a given component. In this you can:
- Browse through different parts of the data
- Visualize images
- Search for specific rows using a search query
- Visualize long documents using a document viewer

Image Gallery#
The image explorer tab enables the user to choose one of the image columns and analyse these images.

Numerical Analysis#
The numerical analysis tab shows global statistics of the numerical columns of the loaded subset ( mean, std, percentiles, ...).

How to use?#
You can setup the data explorer container with the fondant explore CLI command, which is installed
together with the Fondant python package.
Where the base path can be either a local or remote working directory. Make sure to pass the proper mount
credentials arguments when using a remote working directory or a local working directory
that references remote datasets. You can do that either with --auth-gcp, --auth-aws
or --auth-azure to
mount your default local cloud credentials to the workflow. Or You can also use
the --extra-volumnes flag to specify credentials or local files you need to mount.
To stop the data explorer service you can use the following commands:
Example: